Stuck on a step? Text us Email us Request a lesson
For course topics and one-to-one help, see Concordia MATH 209 tutoring.
Before you start: be comfortable differentiating a linear function, using the product rule and calculating a percentage change. This original lesson supports elasticity in Concordia MATH 209; it does not cover the whole course.
A worked model
Demand elasticity: will a price increase raise revenue?
A price increase has two competing effects: more money per unit, fewer units sold. Elasticity tells you which effect wins locally. Work through one demand model, then check what its answer means for a finite price change.
1. Turn a slope into percentage sensitivity
The derivative measures how weekly demand changes when unit price changes. Here : a one-dollar increase in unit price reduces weekly demand by four units. This is an exact change in this linear model. A slope measures a change in units; elasticity compares relative changes and has no units.
For a small price change , let be the resulting change in weekly demand. The local approximation gives the first formula below. Multiplying either relative change by 100 expresses it as a percentage.
Define demand elasticity using the positive convention below. Because demand is decreasing, , so the minus sign makes . An elasticity of means that a small 1% price increase produces approximately a 0.5% demand decrease. Under this convention, is positive for decreasing demand; the factor predicts the demand decrease.
2. Connect elasticity to revenue
Weekly revenue , in dollars per week, is price times quantity sold: . Raising the price adds revenue on each unit sold, while the fall in demand removes sales. The product rule accounts for both effects.
The prime in means differentiation with respect to price. Its units are dollars of weekly revenue per dollar of unit-price change. Since , factoring gives the identity below. Demand is positive on our interval, so the sign of is the sign of .
3. Compare three prices on the same demand line
Substitute to get , then simplify as below. The slope stays at , but elasticity changes because the starting price and starting demand change.
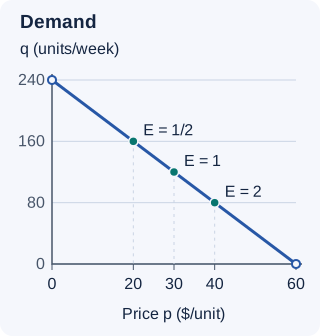
At , demand is units per week and . A small 1% price rise gives approximately a 0.5% demand fall. Revenue initially rises. At , demand is only units and : the same small 1% price rise gives approximately a 2% demand fall, so revenue initially falls.
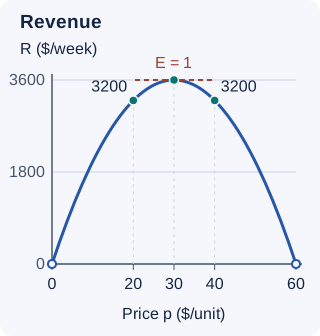
At , demand is units and . The revenue derivative is zero. In this model, is positive below 30 and negative above 30. Revenue therefore reaches its maximum at a price of 30 dollars per unit, with 120 units sold per week and weekly revenue of 3600 dollars.
One constant slope, three elasticity values
Revenue peaks where elasticity equals one in this model
Inelastic
- Price ($/unit)
- 20
- Demand (units/week)
- 160
- Elasticity
- Revenue ($/week)
- 3200
Revenue is increasing with price here.
Unit elastic
- Price ($/unit)
- 30
- Demand (units/week)
- 120
- Elasticity
- Revenue ($/week)
- 3600
Revenue is stationary here; this model has its maximum.
Elastic
- Price ($/unit)
- 40
- Demand (units/week)
- 80
- Elasticity
- Revenue ($/week)
- 3200
Revenue is decreasing with price here.
4. Check the size of the price change
Unit elasticity at one price means zero instantaneous revenue change there. It does not mean that a finite price change leaves revenue unchanged. Let be a change in unit price from 30 dollars, with . Substitution gives the exact change below.
For example, raising the price from 30 to 31 dollars changes revenue from 3600 to 3596 dollars per week. The local estimate misses the four-dollar decrease. The horizontal tangent describes the first-order change at 30; the curved revenue graph still falls on either side.
An inelastic starting point also does not justify an arbitrarily large price rise. From to , this model crosses the revenue maximum: revenue falls from 3200 to 2000 dollars per week. For a specified finite change, compare the two revenue values directly. Constant revenue on an entire interval requires throughout that interval, not just at one price.
Three questions to build your understanding
Foundation: interpret a percentage response
In a new model, , with . Price is in dollars per unit and demand is in units per week. At , find demand and elasticity, classify demand, and estimate the percentage demand change from a 1% price increase. What is the approximate percentage revenue change? Find the unit-elastic price.
Show the explained solution
At , demand is units per week and . Thus : demand is inelastic. A 1% price increase gives approximately a 0.5% demand decrease.
For a small change, divide by . This gives , so the estimated revenue increase is 0.5%. Here the price goes from 20 to 20.2 and demand from 200 to 199. The exact revenue change is from 4000 to 4019.8 dollars per week, a 0.495% increase. The demand estimate happens to be exact because demand is linear; the revenue estimate is approximate.
For the whole model, . Setting gives , so the unit-elastic price is 30 dollars per unit.
Application: compare a local estimate with an exact change
Return to and . Compare a price rise from 20 to 22 dollars with a rise from 30 to 32 dollars. For each, use the starting derivative to estimate the weekly revenue change, then compute the exact change. Explain why unit elasticity does not make the second change zero.
Show the explained solution
The derivative is . Starting at 20, it is 80, so the estimate is dollars per week. Exact revenues are and , giving an increase of 144 dollars per week. The estimate is 16 dollars too high.
Starting at 30, the derivative is zero, so the estimate is zero. But and : the exact change is a decrease of 16 dollars per week. Unit elasticity gives a horizontal tangent at the starting price, not a flat revenue graph.
To check both answers at once, let be the starting price and the price change, with both and in . Expanding gives The derivative estimate keeps only the first term. Both changes have , so both estimates omit .
Transfer: start with inverse demand
A third model gives inverse demand , with . Price is in dollars per unit and quantity in units per week. Rewrite it as and state its price domain. At a price of 50 dollars, find elasticity and the local effect of a price increase on revenue. Then find the revenue-maximizing price, quantity and weekly revenue. Can you also conclude that this price maximizes profit?
Show the explained solution
Multiply the inverse equation by 5: , so , with . Therefore . At , demand is 150 units per week and . Demand is elastic, so a sufficiently small price increase lowers revenue.
Revenue is , and . The derivative is positive for and negative for , establishing the maximum at . At that price, units per week, , and dollars per week. The negative second derivative also confirms the concave-down shape.
No profit optimum follows from demand alone. A cost model and any relevant operating constraints are still needed.
For the next demand question, identify the input, state the positive-price and positive-demand interval, compute elasticity, and distinguish a local prediction from an exact revenue comparison.
Original Nablio explanations and exercises, aligned with elasticity in the Fall 2026 MATH 209 outline (§3.7) and the skills in Concordia’s MATH 209 self-assessment (Question 5). No official exam question is reproduced. Follow your section’s current instructions.
Continue your review
To move from revenue to profit, account for costs and capacity limits.
MATH 209 profit-and-capacity exampleUseful for
Work on the step you’re missing.
Tell us the subject and your preferred time. Nablio confirms the details by text or email.
Request a lesson