Return to Centennial MATH-231 course guide. Tutoring coverage for this course must be confirmed before booking and payment.
Stuck on a step? Text us Email us Request a lesson
How can a graph have a local maximum at height −1 while other branches have positive values? Build the graph of from its domain, limits and derivative signs. Then change one sign in the denominator and explain which features change.
Before you start
You should be able to factor a quadratic, find one-sided limits and use the chain and quotient rules. If those steps need work, revisit domains and limits or the derivative-rule check. For a polynomial example that separates growth from concavity, use the André-Grasset differential-calculus lesson.
This lesson adds a difficulty that those polynomial examples do not have: the graph has separate branches because some inputs are excluded. Use your section’s current outline to decide when curve sketching belongs in your revision.
Notation: all inputs, outputs and coordinates here are real and dimensionless. is the horizontal input and the vertical output. A prime means differentiation with respect to . The symbol means the real numbers; joins sets or intervals. An open interval excludes its endpoints. Infinity is a limiting direction, not an input you can substitute.
Give each piece of evidence a job
- The domain tells you where points can exist. Mark its breaks before any sign chart.
- The function and its limits give heights, intercepts and behaviour near excluded inputs or far along the axes. An excluded input alone does not prove a vertical asymptote; check the limits.
- The first derivative gives tangent slope. A positive sign means increasing; a negative sign means decreasing on the interval being checked.
- The second derivative describes how that slope changes. A positive sign means concave up; a negative sign means concave down.
- The complete domain matters for global claims. A local maximum only compares nearby points. A global maximum must be at least as high as every point in the domain.
For these rational functions, split sign charts at every excluded input and every derivative zero. Within each resulting interval, the factored expressions have fixed signs. Use one test input per interval to confirm those signs; do not carry a conclusion across an excluded input.
Worked example: three branches from one formula
For , find the domain, intercepts, asymptotes, increasing and decreasing intervals, local and global extrema, and concavity. Are there any inflection points? Use the evidence to sketch the graph.
Show a starting hint
Which values are excluded before you differentiate? Put those breaks in both sign charts, then ask whether each proposed feature is an actual point on .
1. Mark the allowed inputs and actual points
The denominator factors as , so it vanishes at −1 and 1. Neither value belongs to the domain:
These are three separate intervals. There is no numerator factor to cancel. The numerator is always 1, so has no zero and no x-intercept. At the allowed input 0, , giving the y-intercept . Since , the graph is symmetric about the y-axis.
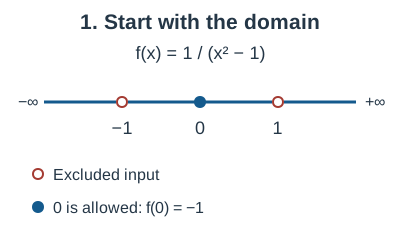
Text equivalent: the domain excludes −1 and 1. The input 0 is allowed and gives the point (0, −1). No part of the graph joins through either excluded input.
2. Use limits to place each branch
Outside the two breaks, , so . Between the breaks, , so . As the denominator approaches zero, its sign determines which infinity the output approaches:
- Approaching −1 from the left: , so .
- Approaching −1 from the right: , so .
- Approaching 1 from the left: , so .
- Approaching 1 from the right: , so .
Thus and are vertical asymptotes. At either far end, the denominator grows without bound and stays positive:
Both outer branches approach the horizontal asymptote from above. The graph never reaches height 0 because its numerator is nonzero. Do not turn that fact into a universal rule: some other functions cross their horizontal asymptotes.
3. Find where the graph rises and falls
Write . The chain rule gives
On the domain, the squared denominator is strictly positive. Therefore the sign of is the sign of : positive when , zero at 0 and negative when . Keep the domain breaks when stating the intervals:
- Increasing on and on .
- Decreasing on and on .
At 0, the sign changes from positive to negative. Thus is a local maximum, and it is also the greatest point on the middle branch. It is not a global maximum: the positive outer branches rise without bound near the asymptotes. The middle branch falls without bound near either break. Consequently has no global maximum and no global minimum. There is no local minimum either.
The excluded inputs ±1 are not stationary points or critical numbers of : a critical number must be in the function’s domain. At 0, describes a horizontal tangent; it does not say that the function’s height is zero.
4. Check concavity without inventing points
Differentiate with the product and chain rules:
The numerator is always positive. The cubed denominator has the same sign as . Thus the graph is concave up on and , and concave down on .
The concavity differs across ±1, but there is no graph point at either input. They cannot be inflection points. The second derivative is nonzero everywhere in the domain, so there is no other candidate; this graph has no inflection points. At 0, , consistent with a concave-down local maximum.
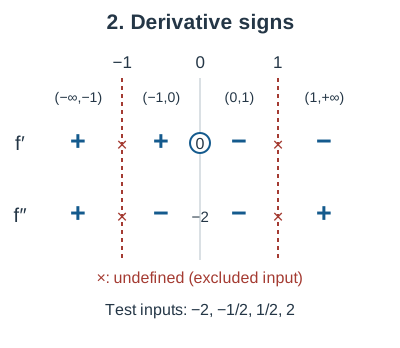
Text equivalent: for x<−1, f′ and f″ are positive; for −1<x<0, f′ is positive and f″ negative; for 0<x<1, both are negative; for x>1, f′ is negative and f″ positive. At x=0, f′=0 and f″=−2. Both derivatives are undefined at the excluded inputs ±1.
5. Assemble and audit the sketch
Draw the asymptotes first, then the point . Draw one branch on each domain interval. The left branch rises from near 0 to , the middle branch rises from to its local maximum and then falls to , and the right branch falls from toward 0. Match each branch’s concavity to the second-derivative signs.
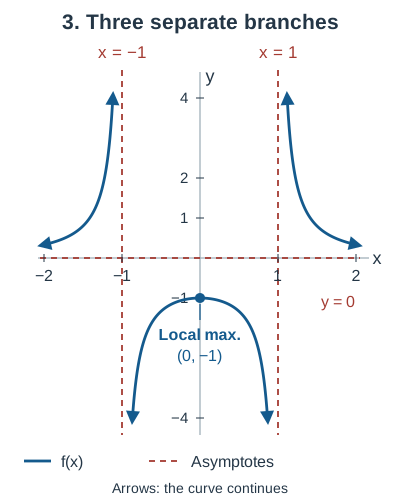
Text equivalent: on the left interval, the graph increases from a limiting height of 0 to positive infinity. On the middle interval it increases from negative infinity to (0, −1), then decreases to negative infinity. On the right interval it decreases from positive infinity toward a limiting height of 0. The outer branches are concave up; the middle branch is concave down.
Final checks: the graph is symmetric about the y-axis; every outer point is above 0; every middle point has height at most −1; there are no points at x=±1. Its range is , which also confirms that neither a global highest nor a global lowest value exists.
Repair two plausible mistakes
“Concavity changes at ±1, so those are inflection points.” First ask for the coordinates of each proposed point. and do not exist. Keep the two concavity changes across the gaps in your description, but remove the claimed points. Never draw a segment through either gap.
“The derivative changes from + to − at 0, so −1 is the global maximum.” That sign test establishes a local maximum. Even the allowed input 2 gives , disproving the global claim. The limit as establishes that no global maximum exists anywhere.
Your turn: remove the domain breaks
Change the denominator and consider . Before calculating, predict whether it has any excluded inputs, whether the graph is above or below the x-axis, and whether the outer parts can still rise without bound.
With the answer closed, find its domain, intercepts, symmetry, asymptotes, increasing and decreasing intervals, extrema and concavity. Locate any inflection points and make a sketch. Decide whether the horizontal asymptote gives a global minimum.
Show a retry hint
For a real input, can vanish? After differentiating twice, solve the numerator equation of and compare signs on both sides. Check that each candidate is an actual point. To decide about a minimum, distinguish “approaches 0” from “equals 0.”
Check the complete retry solution
Domain, points and limits
Since , the domain is all of . The graph is positive and continuous everywhere, symmetric about the y-axis, with y-intercept and no x-intercept. There is no vertical asymptote. As , from above, so remains a horizontal asymptote.
First derivative and extrema
The denominator is positive everywhere. The graph increases on and decreases on . The point is a local maximum and a global maximum: for every real x, with equality at the top only when x=0. There is no local minimum and no global minimum. Although 0 is the greatest lower bound, or infimum, the function never attains it. The range is .
Second derivative and inflection points
The denominator is always positive. The numerator is zero at , positive outside those inputs and negative between them. Thus g is concave up on and , and concave down on .
Here both candidates belong to the domain and g is continuous there. The sign changes establish two inflection points:
Notice the different reasons for splitting the charts: 0 is a zero of g′, while ±1/√3 are zeros of g″. None is a domain break.
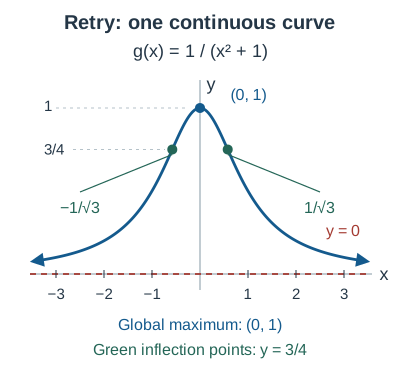
Text equivalent: g rises from a limiting height of 0 to the global maximum (0, 1), then falls toward 0. It bends upward outside x=±1/√3 and downward between those inputs, with an inflection height of 3/4 at each.
Compare your prediction
The denominator’s lower bound of 1 prevents any blow-up. Replacing −1 with +1 removes both vertical asymptotes, makes the output positive everywhere, turns the central maximum into a global one and introduces two genuine inflection points.
Quick transfer: can a horizontal asymptote be crossed?
Let , with domain . You are given . Find the horizontal asymptote and decide whether the graph crosses it. Use the derivative signs to locate its extrema, then justify whether they are global. You do not need a second-derivative chart for this check.
Show a transfer hint
Compare the numerator and denominator degrees for the far-end behaviour. Then check h(0). For the derivative signs, factor ; to check global bounds, use and .
Check the transfer answer
The far-end limits are 0, so is a horizontal asymptote. Yet , and h is negative for x<0 and positive for x>0. It crosses that asymptote at the origin. A horizontal asymptote describes far-end behaviour, not a forbidden height.
The derivative is negative for x<−1, positive for −1<x<1 and negative for x>1. There is a local minimum at and a local maximum at . They are global: the two square inequalities give , with equality at −1 and 1 respectively. This bound checks the entire domain.
Practise the first step you could not justify
If you crossed a gap, redraw only the domain and one-sided limits. If you confused growth and concavity, write one sentence for the sign of f′ and another for f″. If you overclaimed a global extremum, compare that point with all branches and end behaviour. Then close the solutions and redo the changed-denominator question.
Work through your graph with a tutor
Bring a practice question you are allowed to share, your sketch and the first step you could not explain. A tutor can help you keep excluded inputs in both sign charts, justify the direction of each branch and distinguish local extrema from global ones. Use the existing Calculus I tutoring page to request help with this topic; share your course outline so the level, topics and availability can be confirmed before booking.
Useful for
A later application of domain, limits and derivatives, outside the bounded early MATH 203 midterm practice. Marianopolis’s January 2026 description and Vanier’s Fall 2024 outline support historical topic fit only. The McGill MATH 140 connection is optional and broad; check your current section outline for graph-sketching scope. Course guides retain their offering and tutoring-coverage qualifications.
Work on the step you’re missing.
Tell us the subject and your preferred time. Nablio confirms the details by text or email.
Request a lesson